For my beat reporting, I would like to report on how artists use social media to promote their music, and how the type of promoting/amount of promoting affects album and song sales. To do this, I want to dive into Twitter and see popular artists promoting their music.
DJ Khaled is not only able to promote music on his own account, but the featured celebrities he has on also promote it on their accounts. More listeners want to listen to his music even if they don’t like DJ Khaled but like the other artists.
Then there are artists who do shock-drops. Artists such as Taylor Swift and Drake have released albums without doing any promotion, and those albums have soared to #1 on the charts regardless. There isn’t a lot of preparation.
I would also like to take a closer look at artists who aren’t as big and how they have been able to have success through promotion. Many artists used to be up-and-coming through YouTube (Justin Bieber), and now very commonly through TikTok.
TikTok will also be a focus. The app has allowed people to have and sustain music careers. Lil Nas X is a perfect example of this. “Old Town Road” was his first single that went #1 because it went viral on TikTok. He hasn’t looked back since then.
I’d like to look at numbers through sales and digital streaming numbers on Spotify, Apple Music, etc.
In the year 2021, it is no secret that the internet is now a key factor for success in pretty much all industries. Whether one is using it for selling a product, advertising for a business or company, networking, or some of the many other purposes it can serve, the internet has now become essential to flourishing in today’s professional world.
The internet has had a direct impact on the music industry especially in the last decade. Leading streaming services such as Spotify, Apple Music or Pandora have become the new way to listen to music. According to the RIAA’s 2021 report, Recorded music revenues in the U.S. grew 27% in the first half of 2021, reaching up to $7.1 billion, compared to 2020’s amount of $5.6 billion at retail value. Paid subscriptions for streaming services were once again the largest contributor to this growth, comprising nearly two- thirds of total revenue, with more than 80 million paid subscriptions for the first time. Rather than the now old fashion method of going to the store and buying a record or CD, the majority of society pulls out their phone and clicks into their streaming service of choice to listen to their favorite songs. Social media websites and apps specifically, such as Twitter, Facebook, Youtube, and most recently, Tik Tok, are catalysts for success in the music world for many reasons.
Musical artists use social media for various purposes, traditionally their main one was taking advantage of the direct connection with fans to promote upcoming music, merchandise, concerts, or other significant events. Recently, popular apps such as Instagram, Twitter and Facebook have began contributing to an artists streams for the first time. These apps have a feature where you can link a song to a user’s “story”, and for every view, it is now counted as a stream, the same way a listen on Spotify does. The app Tik Tok has skyrocketed in popularity in the last year. The purpose of Tik Tok is centered around viral “trends” that arise from clips of songs, and users recreate these trends in their own unique ways. Each time a video is played on the app, that specific song receives a stream.
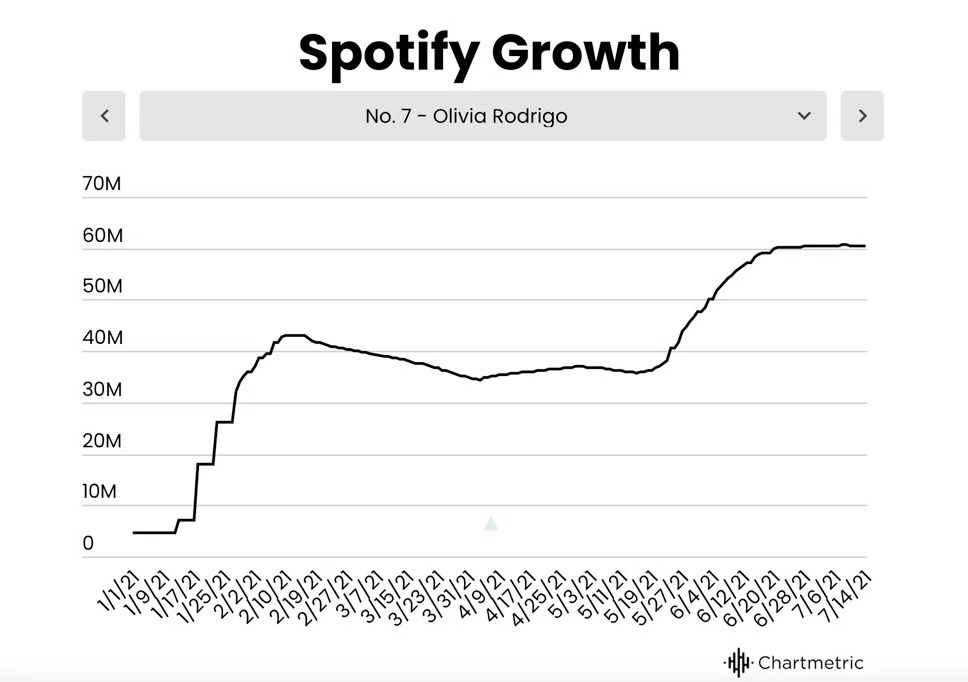
The chart above captures Rodrigo’s Spotify growth before and shortly after the release of “Good 4 U”. There is a clear spike in her streams directly after the release of this Tik Tok friendly hit, going from about 35 million right before the release on May 19th, and nearly doubling at 60 million streams approximately a month later on June 20th.
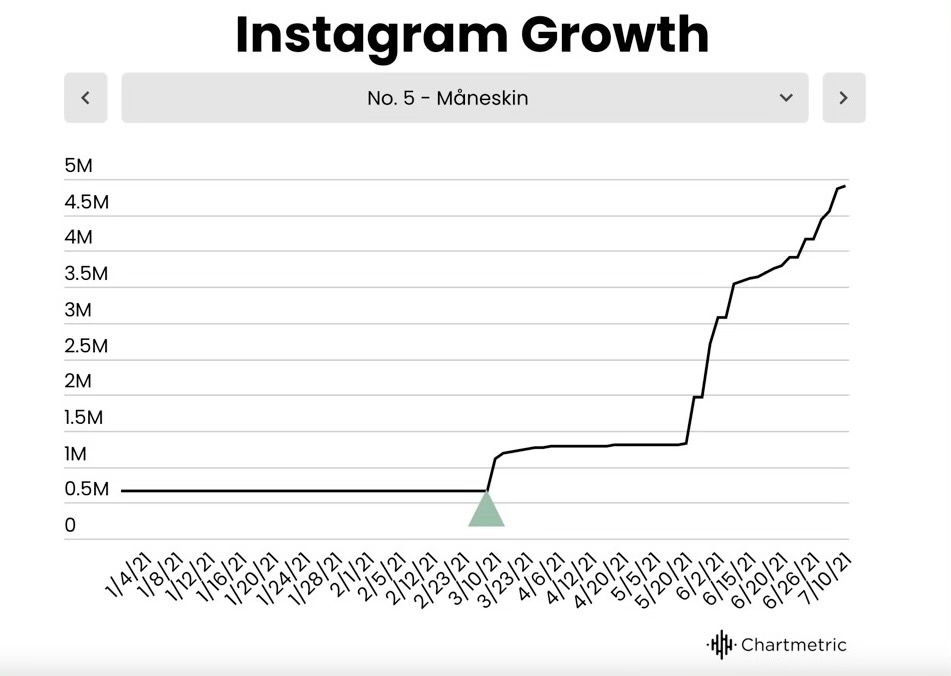
Another notable talent, a group who goes by the name Maneskin, released a version of the song “Beggin”, in 2017. The song has the most streams on their Spotify, currently at over 800 million, double the amount of their second most streamed song at around 400 million. The song became a Tik Tok trend during the summer of 2021, the most viewed video using their song was published on July 2, 2020, and has 52 million views.
The chart above shows the rapid growth the group received on Instagram in the summer of 2021, when their song became a viral trend. On May 5, they had a little less than 1.5 million followers, which was remaining stagnant for a period of time. About two months later on July 10, they had almost reached five million followers. They now have almost six million Instagram followers.
These musical artists received plentiful amounts of brand new exposure, subsequent to their songs going viral on Tik Tok. This app has clearly impacted the music industry in a brand new way, and now plays a part in telling who or what the next sensation will be.
The age of the independent film is upon us. More and more people are being drawn to the alternative storytelling methods and the raw and unfinished looking aesthetics. What makes indie films indie is the lower budget aspect and the fact that they are not produced by studio companies such as 21st Century Fox, Warner Brothers, Disney, and Paramount Pictures. As with these large studio films, the success of the genres of indie films are comparable and show trends of what interests the public as time goes on. Some of the most popular indie genres include Horror, Drama, and Coming of Age.
Horror films are made to scare, horrify, and invoke our deepest fears that we might not have even knew we had. To say that indie horror has been successful in doing that is an understatement. Blumhouse is one of the most well-known independent horror film production companies. According to Rotten Tomatoes, Blumhouse has “become synonymous in horror with low budgets, big returns, and bigger thrills.” They have 81 films under their belt, some of them being household titles. It is said to be the most profitable genre for the indie film industry based on the budget versus the box office success.
Produced by Blumhouse, Get Out has the largest profit on the graph. It takes a different approach to psychological thrillers. It is real and the little and seemingly unimportant tactics that were used made the story seem so real. The 2003 film, Open Water had the lowest profit, however, but not because of the storyline. According to viewers, the film was boring and anti-climactic with bad acting and filming. Taking those criticisms into consideration, indie horror is a powerhouse in box office hits and profit.
Drama films are often focused on real world issues and situations. Whether it be alcoholism, abuse of any kind, or a love story, dramas are meant to invoke emotion. Relatable or not, indie dramas specifically seem the rawest and there are always aspects of the story that you can see in your own life. Indie dramas tend to fly under the radar, turning into cult classics, but one would be surprised at how many they have seen and probably love.
With the 2017 film Call Me By Your Name coming out on top in terms of profit compared to the 2001 film Requiem for a Dream, this idea of cult classics becomes obvious. Call Me By Your name is considered simple yet meaningful and a compelling gesture of wisdom. Requiem for a Dream on the other hand, was deemed intense and scarring due to its drug related subject matter. It appears that there is a very narrow line between too much and the perfect amount when it comes to indie drama films. Some get it right and some become cult classics.
Coming of age films may be seen as inherently indie. This type of film is aimed at showing different perspectives of growing up and the unsteady relationships that young people face on the journey to finding themself. A24 specifically, has made a name for itself in this genre due to their fearless approach at illustrating these types of stories. They push boundaries while upholding their aesthetically pleasing cinematography style. It could be classified as drama but coming of age films focus specifically on the life of a child or teenager. They are also the easiest to make in terms of low budget indie films because there is no need for big productions when trying to make something hyper-relatable.
The 2004 film Napoleon Dynamite came out on top mainly due to its lighthearted, comedic, realistic approach to high school life. It is about a socially awkward teen just trying to find himself. Another interesting thing to note is how it has the lowest budget of this set of movies and still made the highest profit. Movies like this is what proves that you do not need a large budget to create a box office hit. However, the 2017 film The Florida Project did not do so well. It might have been too raw and too big of a pill to swallow because it covers the sensitive topic of children and single parents in poverty. Either way, coming of age movies are not always lighthearted with happy endings. It is just a matter of how they are received.
Independent films are a strange entity to say the least. They either succeed beyond words, or they flop and become a laughingstock. Whether you like being scared or you like crying your eyes out, indie films can give you that. Their genre inclusion can be seen as stronger than the films that major studios provide because of how raw they can be. Indie studios give film directors room to use their own creative direction with little restriction. The horror genre had the most profitable film compared to the other two options because of this free writing idea. It is important in horror because in order to really be successful in being scary, you need that shock factor of never knowing what is coming next. What happens when you give the director almost full creative control, you get passionate and intense stories and storytelling approaches.
With the ongoing trial of accused child sex trafficker Ghislaine Maxwell, formerly the girlfriend of convicted sex offender Jeffrey Epstein, modern slavery, or similarly known as human trafficking, is a hot topic. Human Trafficking involves the transfer of people through “force, fraud, or coercion to obtain some type of labor or commercial sex act,” according to Homeland Securities Blue Campaign.
While attention is on the subject, it’s important to make known the prevalence of the issue, especially for the future of the United States and the World. Victims and convicted traffickers are key figure points in this research that are compared to discover any disproportionalities.
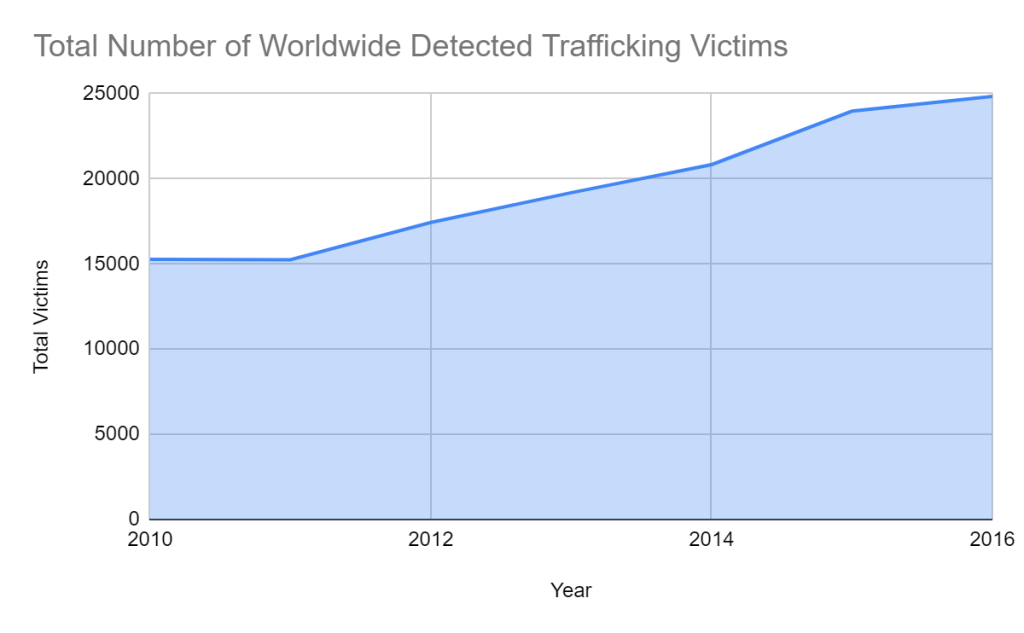
The threat of trafficking is present worldwide, and has been increasing through the years, as seen in data from the United Nations Office on Drugs and Crime, or UNODC.
The data gathered originates from national authorities answers on the annual United Nations Crime Trend Survey. It’s also considered that the amount of countries covered in this analysis doesn’t remain consistent throughout the years, which may be a factor in the results.
In the data, we see a 62.7% increase in victims when comparing the years of 2010 to the most recently available 2016. The comparison is significant, though when comparing 2015 to 2016, an increase of 3.6% is seen. A gradual increase in victims over the years is confirmed regardless of it’s rate of increase.
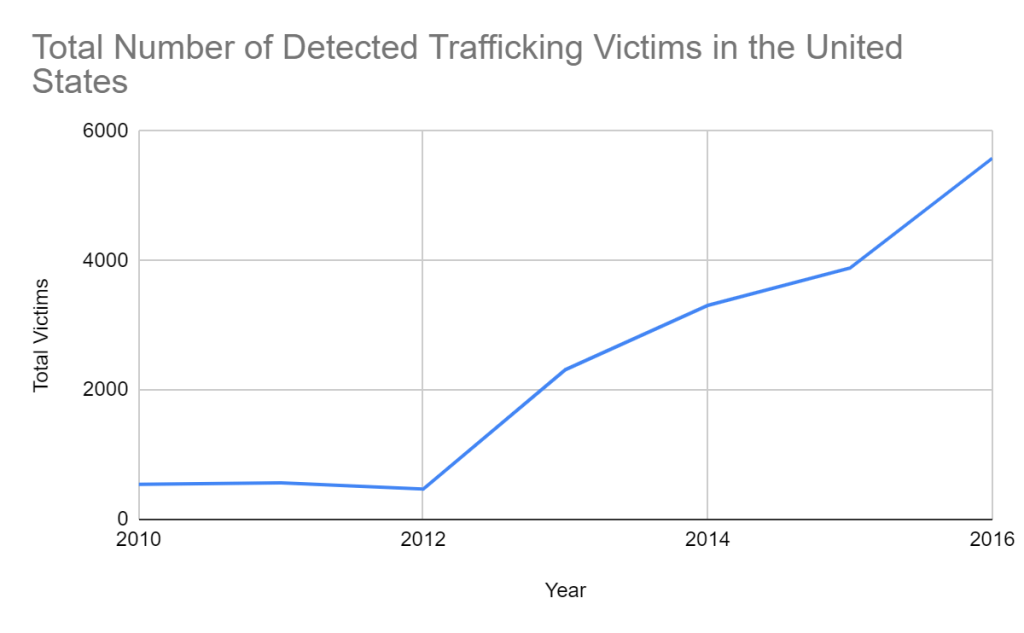
Reported Trafficking Victims Over Time in the United States
The data gathered shows the U.S. had a significant increase of 393.6% in total victims between the years of 2012 and 2013. When comparing 2012 to 2016, a noteworthy increase of 1090% is seen through the data. Another large jump can be seen in comparing 2015 to 2016, with a 43.7% increase.
In 2016, the data shows that the United States total victims make up a significant 22.5% of global victims. Assuming that the number of victims continues to gradually or significantly increase, the U.S. will continue to have, and possibly have more problems with trafficking.
When analyzing the amount of convictions for trafficking, both worldwide and in the U.S., to the amount of victims, a disproportionality can be seen according to data from the UNODC.
Year
2010
2011
2012
2013
2014
2015
2016
Number of Convictions
141
151
138
174
184
297
297
Reported Number of Trafficking Convictions in the U.S.
Year
2010
2011
2012
2013
2014
2015
2016
Number of Convictions
4084
5079
7846
7018
6102
5707
3382
Reported Number of Trafficking Convictions Worldwide
This data was collected through questionnaires given to national authorities, and similar to the data on victims. The countries in which data is collected from aren’t completely consistent through every year.
Data from the United States shows a generally positive trend in the increasing number of convictions between the years of 2010 to 2015. In 2016, no rate of change can be seen, potentially suggesting a plateau in convictions with a continually increasing number of victims.
Worldwide, we see 2012 showing the highest number of convictions, maxing out at 7,846 people. When comparing that to 2016, a decrease of 56.9% is seen. The data shows 2016 as the lowest point in convictions, which can be attributed to less people getting caught.
There appears to be a disproportionate number of victims when compared to actual convictions. With this being said, that can possibly be explained by the number of victims per convicted, though not enough data is available to completely confirm that.
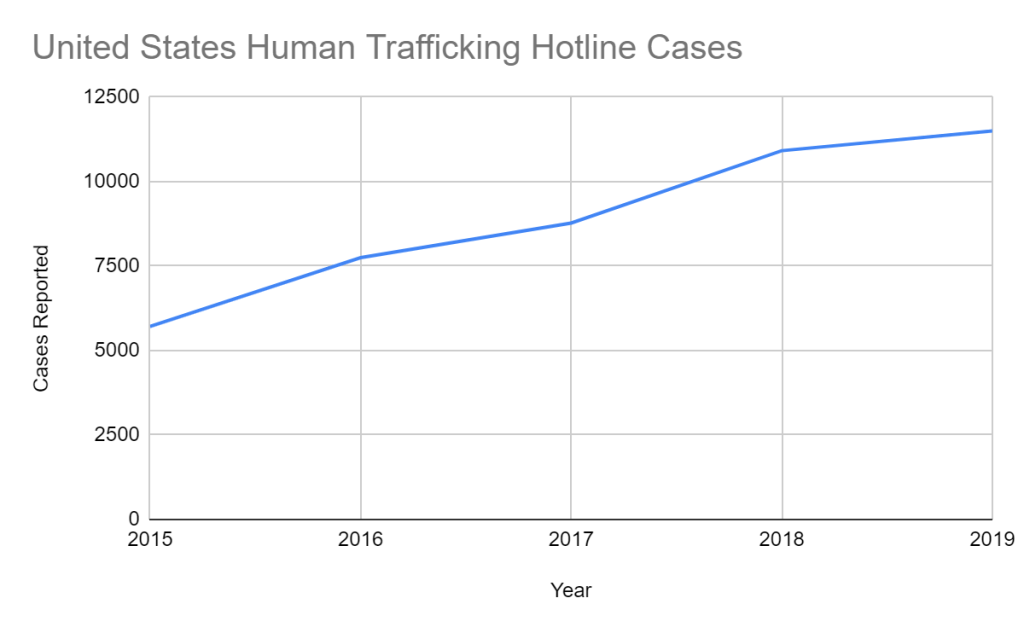
With increasing numbers of victims, methods to keep oneself safe are expected, examples including the National Human Trafficking Hotline. This hotline is able to receive tips on potential trafficking situations, as well as support victims of trafficking.
The increase in victims over time within the United States coincides with an increase in the number of reports or tips, according to data from the National Human Trafficking Hotline.
Reported Number of Human Trafficking US Hotline Cases
Within the years of 2015 and 2016, a 35.6% increase in cases reported can be seen. When comparing trafficking convictions in the U.S., as well as U.S. victims of trafficking within the years of 2015 to 2016, the disproportionality of arrests becomes clear with significantly increasing numbers over time in all cases except convictions.
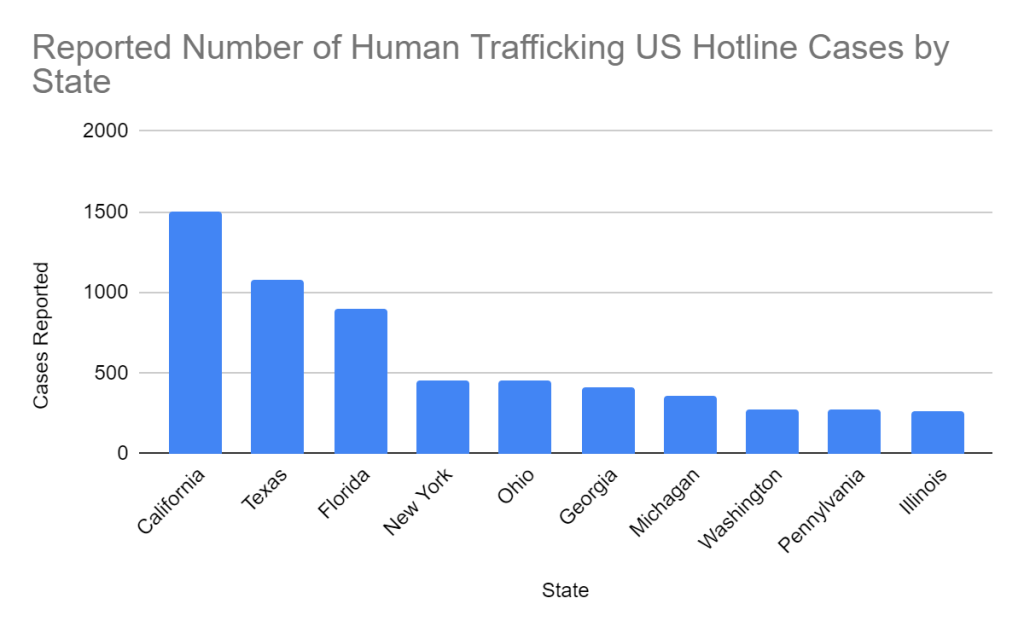
Reported Number of Human Trafficking US Hotline Cases by State
According to the National Human Trafficking Hotline, currently California places at the top of all states in terms of how many cases of human trafficking were reported. Understanding where, and what makes someone more at risk of trafficking than another allows a person and others to be able to protect themselves and understand what signs to look out for.
According to the hotline’s 2019 Data Report, a majority of about 68% of victims tend to be female. The most common areas in which the hotline finds victims of trafficking, be it labor focused or sex work focused, are in “illicit massage, health, and beauty” at most, “illicit activities” in second, and “bars, strip clubs, and cantinas” in third.
Additionally, recruitment tactics of sex trafficking specifically consist of using primarily a relationship/marriage propositions, as well as using family, job offers, and fraud. Labor trafficking consists of primarily job offers and advertisements, as well as fraud.
To conclude, the issue of human trafficking has been significantly increasing through the years, while the number of those who get convicted for trafficking are inconsistently decreasing or plateauing. If the patterns in the data continue as they have been, the problem will only get worse, causing more victims overall. The United States may not be the highest country in the world in terms of trafficking danger, but without increases in arrests and convictions, the problem will persist and terrorize citizens in terms of increasing victims as well as increasing fear over the subject.
Journalists today have many advantages and disadvantages with social media growing so quickly. Considering that journalism is the collection and distribution of news in our communities, it is only natural that journalists use the newest trend of information outlets that influences the greatest current mass of people. Social media is used by about 57% of the world’s population, which is about 4.5 billion users. Then if you compare that number to the total number of readers The New York Times gets monthly which is only 350,000, you can see why journalists would want to utilize these internet platforms. The amount of user’s social media has is exponential compared to the world’s second biggest news outlet, this new trend has changed the way our world has connected with each other like no other time before. Journalists would not be using their greatest tool of their generation if they were not using social media platforms to spread awareness of their stories to the largest audience available.
Social media offers users the chance to discover news before a professional journalist is able to create a story to tell their audience. Everyday people are constantly talking about the newest stories on platforms and sometimes in the most current times. Journalists at times are able to do their own research using what users are posting and sharing on their social media platforms to write their stories with the most updated and related information. However, even though social media gives people the chance to make certain claims and share any information they believe to be true, it can happen that it is a farce. Many people look to social media for news and information, because of the mass outlets, which leaves room for people to leave many false claims and information to help their own stories and narrations. Media manipulation can occur from any news outlet or personal user published on these platforms. According to data from the Pew Research Center, 45% of American adults use facebook as a news outlet, and half of those consumers only rely on Facebook for their news. Many reporters fear for misinformation considering 22% of the American adult population is using a social media platform for news in the world. The importance of reach is well thought out and effective, but the policing of content is loose which leaves those that post any information with a narration of whatever the publisher wishes.
One can imagine with so many users, the amount of current news traffic these social media platforms can have. Based on the Twitter Usage Statistics website that calculates the current amount of tweets sent during the day, it reads that by the time that I finished this sentence, there would have already been 560,590,000 tweets sent out already (its 3pm). That being said, news will come and go just that fast as it is ambushed by all the other stories across the platforms coverage. This creates havoc for journalists to keep their stories as relevant and shared as possible, however it is their responsibility at the same time to ensure that the importance of their story gets the attention required to complete the mission of the story in the first place.
One aspect that I personally believe journalists do love about social media, is the amount of transparency it creates in our societies. The key aspect of social media is their camera functionality and the spread of photos and videos. These photos and videos are shared around the world showing people what they would not normally see from where they are restricted in their communities. To see is to be believed by many people, and although some have even learned to manipulate pictures and videos, it is still the main aspect relied on by many reporters and people if they want to believe a story. Social media enhances the saying that “a picture represents a thousand words”, and without it many people would not have belief in many things around the world. Social media offers people the chance to experience another part of the world without even being there. And in a journalist’s perspective, to be in the story without even being there. A journalist would not have trouble gaining their audience’s attention once they acquire the images they need to verify and spread their story.
Social media should be the main tool and platform successful journalists use to make it in their industry. Once they can master the potential social media platforms offer to them, they can help their audience from mislead information and exposing deceptions and share their stories to the greatest audience they can reach. Social media has a great effect on journalists, and it is up to those journalists on whether or not they let it destroy them or make them.
2021 has seen a lot in terms of social discord, especially in the United States. Having been called the “Melting Pot” since the early 20th century, in the past few years there has been a big debate whether or not that sentiment is still true. Many in America can agree that hate crime is an issue that effects everyone, regardless of race. Recent leadership and decisions made by the government have exacerbated this issue, resulting in increased tensions between groups within the United States. However, there are some groups that are targeted more frequently and more harshly than others are. The question that many people ask, who is the most vulnerable and affected group of hate crime? The answer to this question lies within the numbers, statistics that have been reported all across the country to the NIBRS.
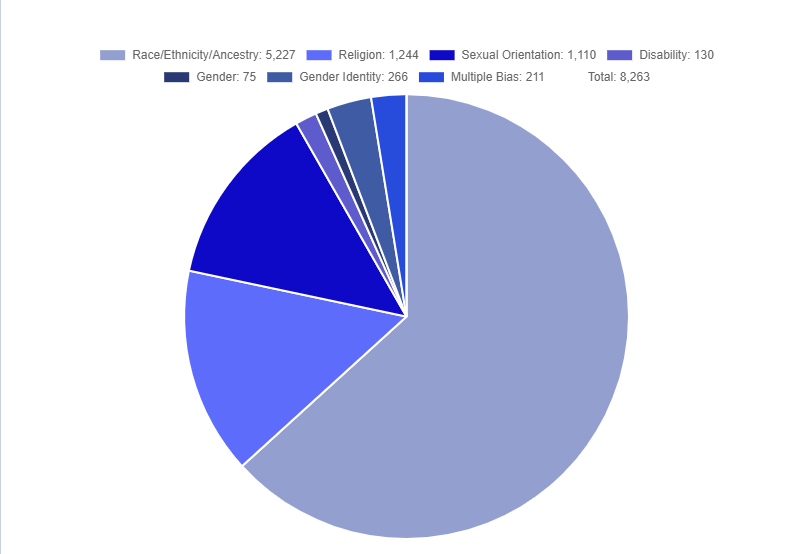
The National Incident-Based Reporting System is a database that gathers data from multiple police departments in America on all types of reported crime. The agency was founded in 1908, more than a 100-years ago, with a budget of over 8-million dollars, annually. All law enforcement agencies across the United states report their crime data to this database, to keep crime levels transparent for the public. Data is collected and categorized based on offense level. The FBI has compiled statistics from the database to show the public all groups affected by hate crimes. According to the FBI, from 2018-2020, there have been 8,263 hate crimes in total against specific groups identified by the FBI as, “motivated, in whole or in part, by the offender’s bias(es) against a race, religion, disability, sexual orientation, ethnicity, gender, or gender identity.”. If we break down the numbers by group, 9,181 crimes are based on an individuals race or ethnicity. A whopping 4,843 crimes were targeted against Black or African American, followed by 1,646 crimes committed against people of Jewish identity. The third most vulnerable group to hate crimes is people of white descent or European ancestry. From this data collected, we can see that regardless of race or creed, there will always be a criminal offender looking to attack one group or another. But it appears that the most vulnerable group to hate crimes is people of Black or African American descent. This information correlates with what many Americans have been seeing on the news or social media.
Pie chart from the FBI
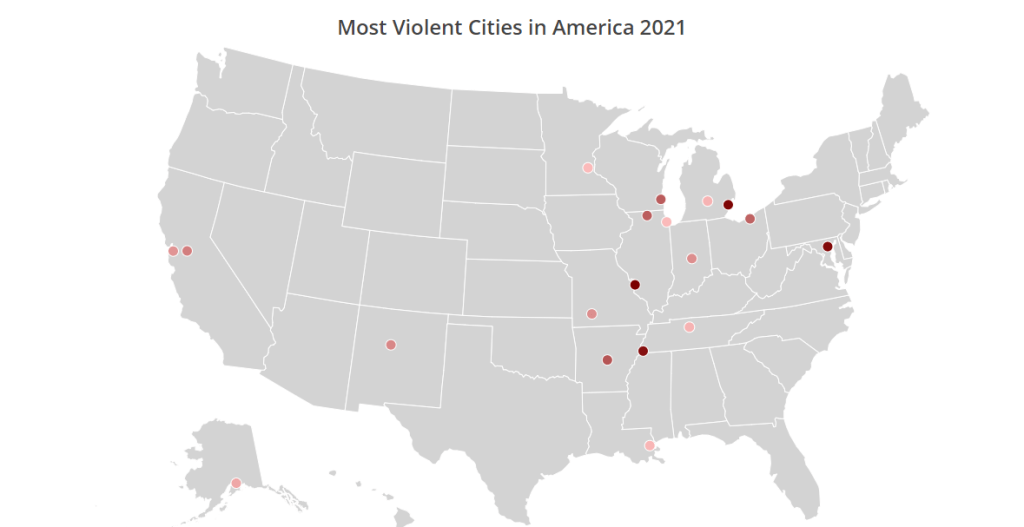
Another question many readers may be asking is, where do most of these hate crimes occur? Typically, people look to cities when they think of places where crimes occur the most, or even rural areas. A constant through history has always been that cities are less safe than suburbs or other parts of America. Typically, people have seen these as easy places to commit crimes, for example, the world population review has gathered statistics that rank the 19 cities in America with the highest violent crime rates. Taking a look at the map that they provided, we can see that many of these cities are in the middle of the country, with some coastal cities.
Map provided by World Population Review
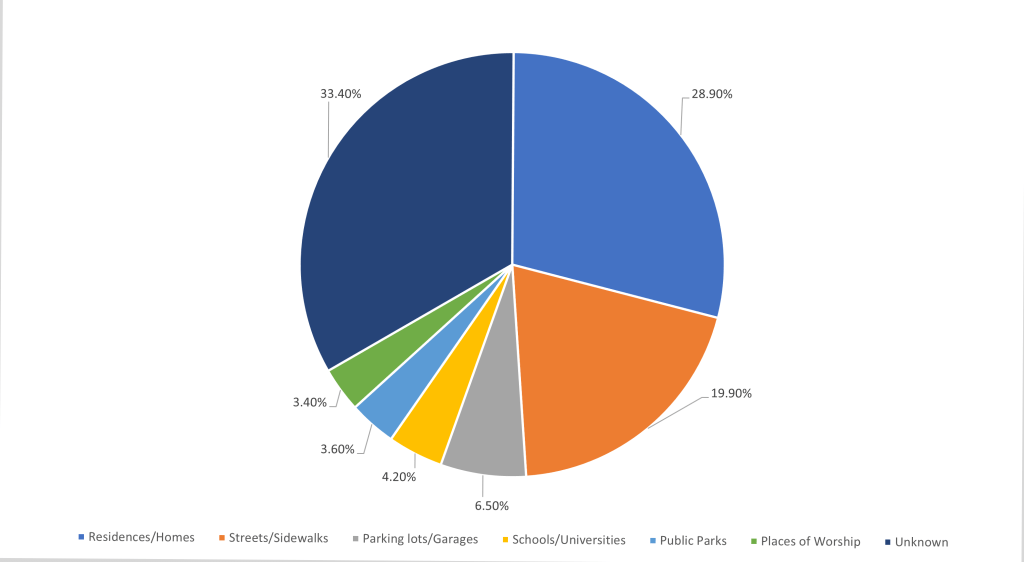
Looking at statistics gathered by the Department of Justice, location types for hate crimes primarily occur on or near private residences or homes, with this number reaching 24.6%. following this, 18.2% of hate crimes occur on streets, highways, and sidewalks. The private residence statistic adds to the fact that these are premeditated hate crimes because they are specifically targeted at these vulnerable groups. Offenders are going after these groups in their homes and outside of where they live, on the streets and sidewalks.
Locations where hate crimes are most likely to occur
Numbers on chart provided by DOJ
In looking at the statistics of hate crimes, the numbers tell us that the most affected group of these acts, are Black and African Americans. In the past two years, movements have gained more traction from these numbers, noticing that this type of hate is unacceptable in any society. In America, it is especially abhorrent as this nation was founded on principles that welcome any and all to this bastion of democracy. Immigrants from other countries have helped pave the way for America to get where it is today, and these immigrants come from many groups that are being attacked by hate crimes today. Poor leadership and lack of communication throughout the country have cultivated an environment of hate in the past few years. However, this is not irreparable. If the people of the United States continue to work towards peace and change within the republic, we could see an end to hate crimes.
On April 18 2021, a dozen of the worlds most successful, decorated and famous football teams announced plans to form a breakaway league called the ‘European Super League’ (ESL).
However, the plans received much criticism and most clubs have since pulled out of the plans. The teams who first planned to be part of the league included Arsenal, AC Milan, Chelsea, Atletico Madrid, Inter Milan, Liverpool, Manchester City, Manchester United and Tottenham. The three teams who are yet to denounce the plans and continue working towards the project include Real Madrid, Barcelona and Juventus.
Basics of the League-
The league would have featured the 12 clubs originally planned, and three other teams would have then been selected based off performance and would have been the other founder members of the league. Each season a further five teams would qualify based on success the previous year.
The format of the league would have been two groups of ten teams, each team playing one another home and away in a group stage. The top three teams from the group round would then automatically qualify for the quarter finals and a playoff between the 4th and 5th teams from each group would be played to decide who got the last quarter final spot from each group.
The funding for the league is almost as ludicrous as the idea for some. JPMorgan Chase, the American financial Goliath is the source of funding for the league. The funding for this new competition is set to be a total of $3.8 billion dollars.
Pundits Opinions-
Gary Neville, ex Manchester United player and Sky Sports pundit strongly opposed the idea of the league. “It’s an absolute disgrace and we have to wrestle back the power in this country from the clubs at the top of this league and that includes my club”.
Neville went on to say, “I’ve been talking for 12 months as part of another group for an independent regulator to bring checks and balances into place to stop this happening.”
Fans Opinions-
Football fans in Europe and around the world were amongst the most angry at the decision. They were furious that many of the top clubs could disrespect the other teams around Europe and initially sign up to this league.
A poll completed by YouGov found that out of all football fans in general 68% strongly opposed the proposal and a further 11% somewhat opposed the idea. Interestingly, 79% of fans of traditional ‘top six’ clubs strongly opposed the idea, whereas only 64% of fans who did not support a top six club strongly opposed the proposal of the league.
Many football fans were angered and outraged over the European Super League proposal. One of the main reasons for this was because fans feel that every club should be able to progress on its own merit as part of the football pyramid in England which is built off the idea that clubs in the lower divisions can dream about their club one day reaching the Premier League.
Another reason is that many fans especially those from working class backgrounds feel that they are being betrayed. The is because the rich owners of clubs who are often from foreign countries such as the US do not understand the working class principles the game and league were built off. They are primarily concerned with business and getting richer.
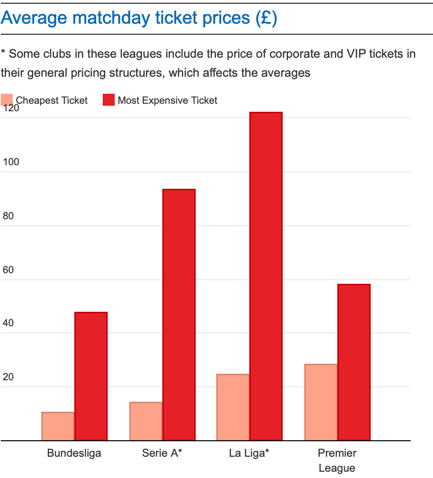
It should also be noted that even though the German Bundesliga are included in the figures below, none of the German teams announced they would be joining the ESL. This is predominantly because of the rule in German football that fans must own the majority (at least 51%) of the clubs.
An article by ‘This is money’ showed how ticket prices have soared since the 1990s in the Premier League. Liverpool have had the most increase in ticket prices between the 1989-90 and 2011-12 season with a staggering 1,025% increase in price. There are several reasons for this including rich owners wanting to make large profits and ludicrous TV and sponsorship deals with companies such as Sky Sports and NBC in the US.
The pandemic also played a major role in the ESL plans. Most clubs were hard hit by the lack of spectators during the pandemic. The Juventus president: Andrea Agnelli, announced that every football club at every level would ‘take to its rightful place in the world’.
* Some clubs in these leagues include the price of corporate and VIP tickets in their general pricing structures, which affects the averages.
Other reasons why fans are against the leagues proposals are because the game will likely become more boring this coupled with the fact that the majority of the top teams in Europe will never be relegated and will always remain in the league.
However, despite many people’s scepticism some fans are behind the idea. Some believe that it would prevent clubs going out of business and allow teams to rebuild without the stress of being relegated.
In conclusion it is clear that many football fans, players, managers and those who understand the traditions in society of football do not want to see a European Super League with the top richest teams never being relegated. However the question remains has the power of owners become too much? and should European clubs move to the model of top German clubs where fans own majority stakes in their clubs?.
With climate change occurring many resources necessary for wildlife to survive is becoming harder for them to obtain. With weather conditions being so harsh it is making the lives of wildlife much harder to find the resources they need and causing many animals to start becoming endangered. This is important because with so many animals losing their habitats or not being able to find food there’s going to many endangered animals. On the World Wildlife website, they already have 29 species listed as endangered and there’s many species on the list as critically endangered and vulnerable. Some examples of animals that are already being impacted are sea turtles because they are having a hard time trying to find sites nests because of temperature changes and all of the storms. Polar bears are also a big one and were on the list of threatened species to go extinct in 2008 from the lack of habitat that they need to be able to find food and survive in the wild. Polar bears live off of seals but since theirs is a loss of sea ice its causing them to be in trouble since this is making it harder for them to find their food. Climate change is making some war blooded animals shape shift, researchers have been noticing that these species legs, ears, and beaks have gotten larger this is because animals must adapt to the climate changes. But just because these animals are shape shifting to be able to adjust to the climate conditions does not mean that they are not struggling and living completely fine, it just means that they are evolving in order to try and survive. These animals need help from going extinct and it’s hard for people to help these animals, there are places like rescue centers for wildlife where people do try to take care of species that are going extinct, but people think that’s harmful to them because they are wildlife and should be in the wild not held in captivity. But they aren’t realizing that if some of those animals were not in captivity they would have less of a chance of surviving. In an article I read they talked about how they are trying to help these endangered species by advocating for them and protecting and restoring habitats for these animals, but climate change is definitely making it much harder for them. In the article they wrote, “Climate change is making the protection of endangered species increasingly challenging. Climate change not only affects our plants and animals directly—through changes in temperature and precipitation for instance—but can worsen the impact on endangered species of traditional threats, such as invasive species, wildfires, and diseases.” It’s important for others to see how people are trying to help even if it is difficult, so that way more and more people will want to help as well and see the importance of helping these species from becoming endangered.
These animals don’t have many options on what they can do by themselves, the only things they can do to survive is move or adapt. Most animals move to high elevations to get away from really warm temperatures but with changing so fast it harder for them to move away and if they move, they run into other problems such as finding food and competing with other species to find food. But people can help these species by creating strategies that would work towards decreasing the number of endangered species by protecting habitats that are needed for these animals to survive and preserving the eco system.
The New York Knicks made the playoffs for the first time since 2013 in the 2020/2021 NBA regular season.
Despite losing 4-1 in the first round to the Atlanta Hawks head coach Tom Thibodeau led Knicks to their first playoff birth for eight years. The Knicks over-performed by making the playoffs and with the addition of point guard Kemba Walker to the Knicks’ offence coupled with their young talent, the 2021/2022 season could mean further success for the Knicks.
The Knicks record last season was .596 which was the first season that they boasted a .500 record since the 2012-13 season. The Knicks primarily had their defence to thank for their playoff run.
The Knicks had the best defence in the league during the regular season, on average giving up 105 points against their opponents per game. The Knicks defence was led by Julius Randle who averaged nine defensive rebounds and Nerlens Noel who averaged two blocks.
Despite the Knicks not being as prolific in scoring with 107 points per game – 26th in the league – they were able to grit out wins and obtain the 4th seed in the eastern conference.
The Knicks’ offence was also primarily run through Julius Randle who averaged 24 points and six assists, along with contributions from RJ Barrett with 18 points three assists, Reggie Bullock with 11 points and Elfrid Peyton with 10 points, three assists per game.
The bench largely contributed to the Knicks’ success during the regular season. Veteran Derrick Rose averaged 15 points, four assists and Alex Burks 13 points, two assists per game. Young players such as Immanuel Qucikley, Obi Toppin and Kevin Knox and veterans Taj Gibson and Austin Rivers also made valuable contributions.
Despite a successful regular season campaign claiming the 4th seed in the eastern conference, the Knicks lost 4-1 to the Hawks in the first round of the playoffs.
One of the main issues during the Hawks series was that the Hawks were able to keep tabs on Julius Randle. Randle averaged 18 points and four assists per game during the playoffs, six and two fewer than his regular season stats.
Randle’s shooting percentage let him down against the Hawks. Randle shot .456 field goal percentage during the regular season compared to only .298 during round 1 of the playoffs. Similarly Randle’s three-point field goal percentage was also down from .411 to .333 in the playoffs against the Hawks.
However, looking ahead to the upcoming season, the Knicks – despite being expected to finish lower in the eastern conference – can look forward to what could be another successful season. Young players such as Obi Toppin and Immanuel Quickley enter their sophomore seasons and look like they are only going to improve, the Knicks also bolstered their roster with the addition of point guard Kemba Walker and shooting guard Evan Fournier both from the Celtics.
Walker averages 20 points, five assists during his career. Walker also has a 42% field goals percentage and 36% three-point field goal percentage. The Knicks starting point guard last season was Elfrid Peyton who averages 11 points, 6 assists per game and has a 45% field goal percentage and 29% three-point field goal percentage in comparison.
The Knicks shot a low number of three pointers last season, averaging only 30.1 three point shots attempted per game (26th in the league) and therefore the addition of a proven three point shooter in Fournier who has 1,050 career three- pointers will again help their offence to improve.
The Knicks’ defence will also be bolstered further with the return of Mitchell Robinson. Robinson is 7ft with a 7ft4 wingspan and averages seven rebounds, one steal and two blocks per game.
The upcoming NBA season looks to be an exciting one for the Knicks. Their new additions to the roster and success last season could mean another successful season and New York fans for once seem excited about the future of the franchise.
In the year 2021, it’s no secret that the majority of our entertainment now comes in a digital form. Whether it’s music, sports, our favorite shows, or even the newest movies, society now heavily relies on apps and streaming services to access all types of content.
Last year, working around the obstacles that many different industries were faced with due to the pandemic, the music industry still saw a year of growth. Between retail store closings and live tour cancellations, music was depending on only its digital outlets, such as streaming services and social media apps, to stay afloat. Instead of taking a hit, the music industry seemed to find new ways to flourish. During that unforeseen time period, not only did the music music industry’s revenue reach its fifth year in a row of overall growth with a 9.2% increase, reaching a value of 12.2 billion, but streaming services saw an extreme spike in subscription purchases, according to the Recording Industry Association of America’s (RIAA) end of year report for 2020. Leading streaming services, such as Apple Music, Spotify or Tidal made up 83% of this total.
A new factor that’s playing a key role in this digital surge is the help musical artists are receiving from social media. One specific app, Tik Tok, became a large part of millions of new users daily lives back in 2020, when there was not much to do for a few months outside of our own homes. A snippet of a song will become popular on Tik Tok due to a dance or joke based off of it, and then its millions of users become encouraged to film and upload their own version of this trend with the song playing in the background. Around 63% of Tik Tok users will discover a new song or artist through scrolling on this app, and will then pull the artist up on a streaming service to hear the full version of the viral song. Not only do these viral Tik Tok “trends” expose it’s millions of users to new music to seek out on other platforms, but it pays royalties to the artists, just like a traditional streaming service would.
Similar to Tik Tok, other social medias like Instagram and Twitter have features that allow you to add music to a post, or “story”, which leads to the same process where a user will then search for a new song they’ve been exposed to on a streaming site. Social media has opened up a brand new window of opportunity for artists, which was tremendously realized last year.
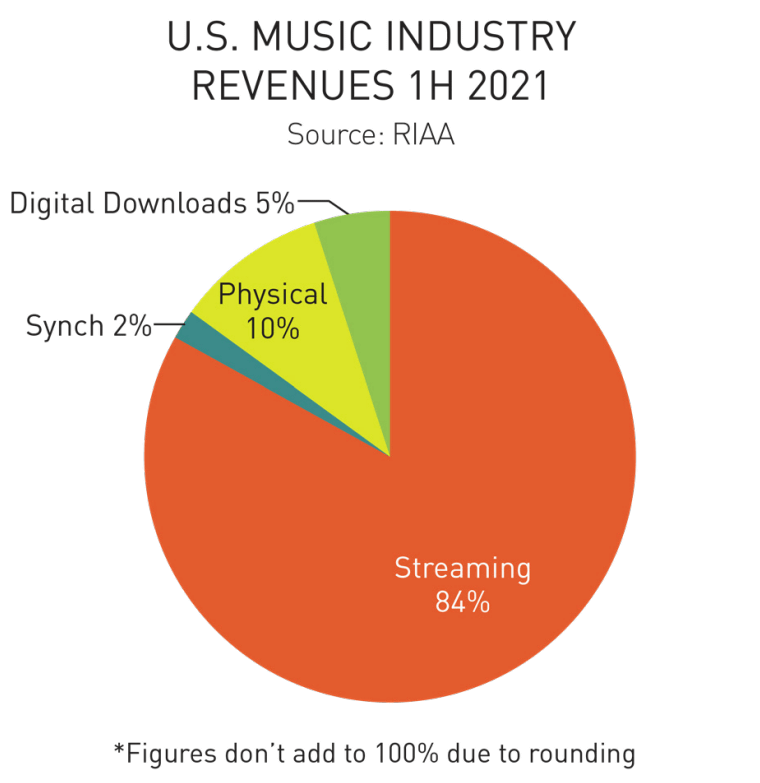
Although this soar for the music industry was the result of our period of isolation, it seems like these methods for music distribution won’t be going anywhere. The RIAA released their mid year revenue statistics report for 2021. Streaming services makes up about 84% while digital downloads are making up about 5%, which means about 89% of recorded music’s revenue is coming from a digital source. As of 2021, only about 10% of revenue is coming from physical copies, which includes CDs and vinyl records.
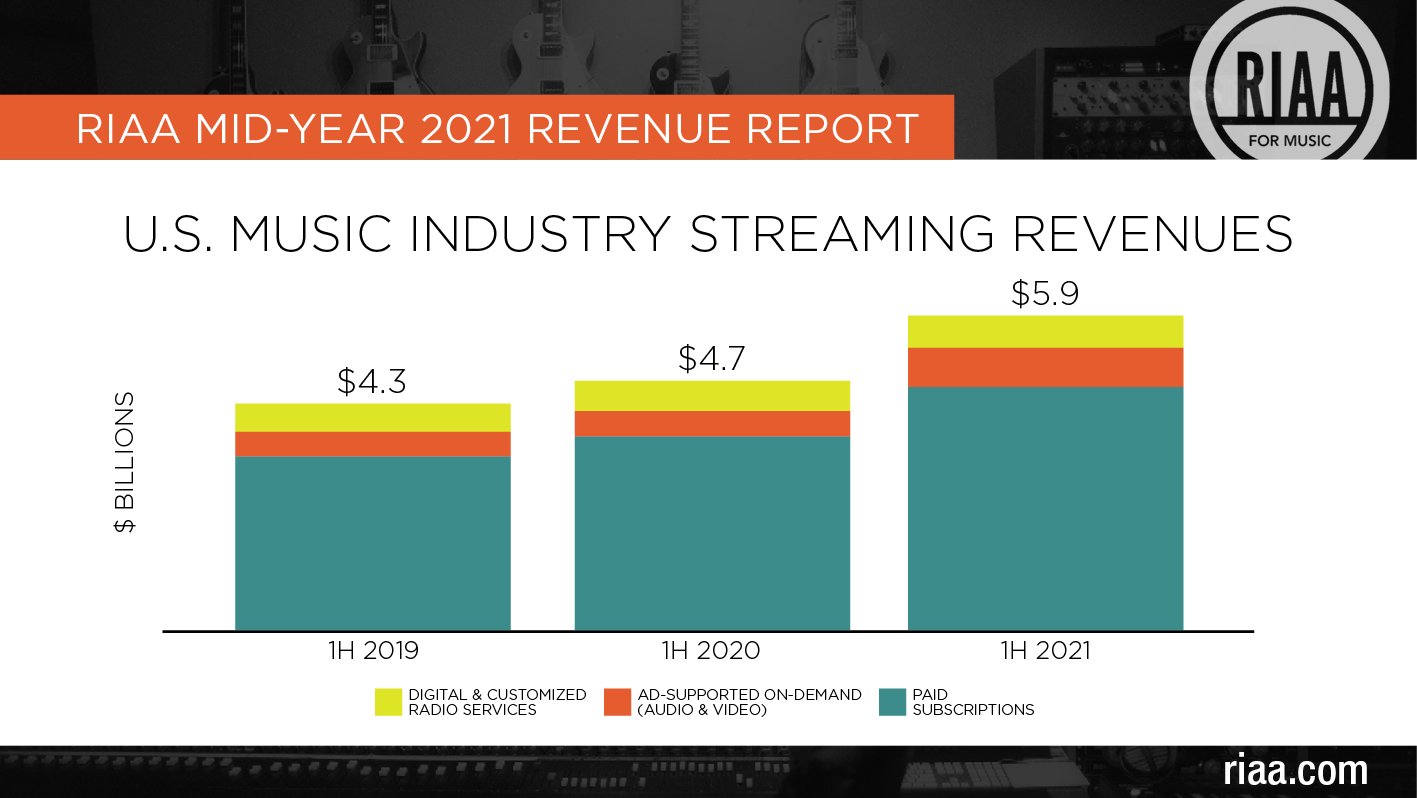
The chart below shows the growth of different streaming options from 2019- 2021. All three of these years, streaming services occupied the majority of the overall revenue percentage, and as the years go on there has been an evident increase in these already dominating percentages.
For paid subscriptions alone in 2021, there was a new record of 82 million users, and this number is not even counting multi-user subscriptions as more than one. This number is 13% higher than it was for 2020, which was 73 million. With last years huge dependency on digital sources for music, to have an even larger spike in 2021 likely suggests the digital shift we encountered when society was confined to their homes last year has opened up new opportunity for the music industry that is not leaving anytime soon.


/cdn.vox-cdn.com/uploads/chorus_image/image/69957687/1345043888.0.jpg)